
Meet your fellow workers.
The State of Working America

 (Click here for this comprehensive survey by the Economic Policy Institute)
The Economic Policy Institute
is a great sources for economic information with an eye to the disparities the exist in the US.
Report | Wages Incomes and Wealth
 CEO Pay Continues to Rise as Typical Workers Are Paid Less
Issue Brief #380
Share this page:
The 1980s, 1990s, and 2000s were prosperous times for top U.S. executives, especially relative to other wage earners and even relative to other very high wage earners (those earning more than 99.9 percent of all wage earners). Executives constitute a larger group of workers than is commonly recognized, and the extraordinary pay increases received by chief executive officers of large firms had spillover effects in pulling up the pay of other executives and managers.1 Consequently, the growth of CEO and executive compensation overall was a major factor driving the doubling of the income shares of the top 1.0 percent and top 0.1 percent of U.S. households from 1979 to 2007 (Bivens and Mishel 2013). Income growth since 2007 has also been very unbalanced as profits have reached record highs and, correspondingly, the stock market has boomed while the wages of most workers (and their families’ incomes) have declined over the recovery (Mishel et al. 2012; Mishel 2013). It is useful to track CEO compensation to assess how well this group is doing in the recovery, especially since this is an early indication of how well other top earners and high-income households are faring through 2013. This paper presents CEO compensation trends through 2013 and finds:
Trends in CEO compensation last year:
- Average CEO compensation was $15.2 million in 2013, using a comprehensive measure of CEO pay that covers CEOs of the top 350 U.S. firms and includes the value of stock options exercised in a given year, up 2.8 percent since 2012 and 21.7 percent since 2010.
Longer-term trends in CEO compensation:
- From 1978 to 2013, CEO compensation, inflation-adjusted, increased 937 percent, a rise more than double stock market growth and substantially greater than the painfully slow 10.2 percent growth in a typical worker’s compensation over the same period.
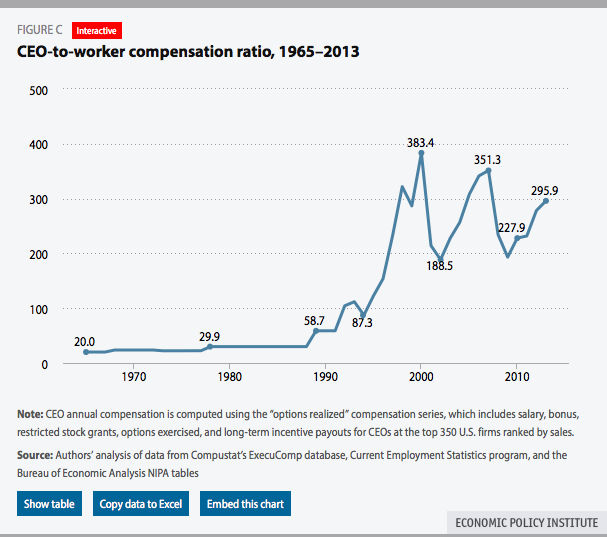
- The CEO-to-worker compensation ratio was 20-to-1 in 1965 and 29.9-to-1 in 1978, grew to 122.6-to-1 in 1995, peaked at 383.4-to-1 in 2000, and was 295.9-to-1 in 2013, far higher than it was in the 1960s, 1970s, 1980s, or 1990s.
- If Facebook, which we exclude from our data due to its outlier high compensation numbers, were included in the sample, average CEO pay was $24.8 million in 2013, and the CEO-to-worker compensation ratio was 510.7-to-1.
CEO compensation relative to that of other high earners:
- Over the last three decades, CEO compensation grew far faster than that of other highly paid workers, those earning more than 99.9 percent of other wage earners. CEO compensation in 2012 was 4.75 times greater than that of the top 0.1 percent of wage earners, a ratio 1.5 higher than the 3.25 ratio that prevailed over the 1947–1979 period (this wage gain is equivalent to the wages of 1.5 high wage earners).
- Also over the last three decades, CEO compensation increased further relative to other very high wage earners than the wages of college graduates grew relative to those of high school graduates.
- That CEO pay grew far faster than pay of the top 0.1 percent of wage earners indicates that CEO compensation growth does not simply reflect the increased market value of highly paid professionals in a competitive market for skills (the “market for talent”) but reflects the presence of substantial rents embedded in executive pay (meaning CEO pay does not reflect greater productivity of executives). Consequently, if CEOs earned less or were taxed more, there would be no adverse impact on output or employment.
CEO compensation trends
Table 1 presents trends in CEO compensation from 1965 to 2013.2 The data measure the compensation of CEOs in large firms and incorporate stock options according to how much the CEO realized in that particular year by exercising stock options available. The options-realized
Go to complete report: http://www.epi.org/publication/ceo-pay-continues-to-rise/
Report: CEOs Earn 331 Times As Much As Average Workers, 774 Times As Much As Minimum Wage Earners
With CEO compensation analysis season in full swing, the AFL-CIO released data this morning stating that American CEOs in 2013 earned an average of $11.7 million–an eye-popping 331 times the average worker’s $35,293.
Though down from 2012′s 354-to-1 CEO-to-worker pay ratio, the multiple more than doubles when compared to minimum wage workers; the average CEO in 2013 out-earned this group 774 times over.
The data was released as part of AFL-CIO PayWatch 2014, which focuses on summary compensation and highlights worker narratives from five companies– including Wal-Mart, Darden Restaurants DRI +1.09%, and T-Mobile– known for low worker wages and high executive compensation.
Information is further broken into categories including compensation by industry and state. As of April 2014, Michigan, Nebraska, and Rhode Island have the greatest CEO to minimum wage worker pay ratios, with New York and Colorado following close behind.
Data used to calculate average worker compensation was based on BLS information for production and nonsupervisory employees.
“People who earn minimum wage, for instance, can’t afford cell phones from T-Mobile or dinner at Red Lobster or the Olive Garden, both of which are owned by Darden Restaurants,” said AFL-CIO President Richard Trumka in a statement from the organization.
“America’s CEOs—as exemplified by the individuals of these companies—are cannibalizing their own consumer base.”
Follow me on Twitter @KathrynDill.
Souce: Forbes Magazine